Graph aggregation by example
This example covers creating aggregate graphs. The configuration reads the current and power from two UPSes (i.e. two hosts with two plugins each) and then creates one virtual host with two virtual plugins; one for current and one for power.
Plugins involved
The example uses a plugin for monitoring UPSes through SNMP, where the UPS address and the different aspects are defined through symlinks. The two UPSes, called “ups-5a” and “ups-5b”, are monitored with respect to “current” and “power”. Thus, the affected plugins are called as:
snmp_ups_ups-5a_current
snmp_ups_ups-5b_current
snmp_ups_ups-5a_power
snmp_ups_ups-5b_power
The original plugin name is actually “snmp_ups__” - note the “two” underscores at the end. The plugin is then symlinked to the given host name(s) (e.g. ups-5a) and what we want to monitor (e.g. power). Let’s just take one closer look at one of them:
snmp_ups_ups-5a_power
-------- ------ -----
    |       |     |
    |       |     `--- The function we want to monitor
    |       `--------- The node name of the UPS
    `----------------- The plugin
Extract from munin.conf
The following extract from /etc/munin/munin.conf is explained in detail, step by step, below the configuration.
 1 [UPS;ups-5a]
 2        address 127.0.0.1 # localhost fetches data
 3
 4 [UPS;ups-5b]
 5        address 127.0.0.1 # localhost fetches data
 6
 7 [UPS;Aggregated]
 8         update no
 9         contacts none
10
11         snmp_ups_current.update no
12         snmp_ups_current.graph_args --base 1000 -l 0
13         snmp_ups_current.graph_category UPS
14         snmp_ups_current.graph_title Aggregated input/output current
15         snmp_ups_current.graph_vlabel Ampere
16         snmp_ups_current.inputtotal.label Input current
17         snmp_ups_current.outputtotal.label Output current
18         snmp_ups_current.graph_order inputtotal outputtotal
19         snmp_ups_current.inputtotal.sum \
20                         ups-5a:snmp_ups_ups-5a_current.inputcurrent \
21                         ups-5b:snmp_ups_ups-5b_current.inputcurrent
22         snmp_ups_current.outputtotal.sum \
23                         ups-5a:snmp_ups_ups-5a_current.outputcurrent \
24                         ups-5b:snmp_ups_ups-5b_current.outputcurrent
25
26         snmp_ups_power.update no
27         snmp_ups_power.graph_args --base 1000 -l 0
28         snmp_ups_power.graph_category UPS
29         snmp_ups_power.graph_title Aggregated output power
30         snmp_ups_power.graph_vlabel Watts
31         snmp_ups_power.output.label Output power
32         snmp_ups_power.graph_order output
33         snmp_ups_power.output.sum \
34                         ups-5a:snmp_ups_ups-5a_power.outputpower \
35                         ups-5b:snmp_ups_ups-5b_power.outputpower
Explanations, per line
- 1 - 2: The SNMP-based plugin for the UPS known as “ups-5a” is defined. The group name is “UPS” and the node name is “ups-5a”. The plugin is run from localhost.
- 4 - 5: The SNMP-based plugin for the UPS known as “ups-5b” is defined. The group name is “UPS” and the node name is “ups-5b”. The plugin is run from localhost.
- 7: The group and “virtual node name” for the aggregated graphs are defined. The group name is “UPS” and the virtual node name is “Aggregated”.
- 8: Make sure that Munin (specifically, “munin-update”) does not try to actively gather information for this node.
- 9: Tell “munin-limits” not to send alerts if any limit is breached.
The above lines (1 - 9) have now established the fundament for three different graph pages; one for each of the two UPSes and one for the aggregate graphs.
- 11 - 15: Define the basic information for the virtual plugin for aggregated current. Note that “snmp_ups_current” is the virtual plugin’s name.
- 16 - 17: Simultaneously define and label “two” values to be graphed in the virtual plugin: “inputtotal” and “outputtotal”.
- 18: Order the values.
- 19 - 21: Calculate the value for “inputtotal” by reading the “inputcurrent” values from each of the two UPSes.
Let’s take a closer look at the components
snmp_ups_current.inputtotal.sum \
---------------- ---------- ---
        |             |      |
        |             |      `-- The sum mechanism
        |             `--------- One of this virtual plugin's values
        `----------------------- The name of the virtual plugin
ups-5a:snmp_ups_ups-5a_current.inputcurrent \
ups-5b:snmp_ups_ups-5b_current.inputcurrent
------ ----------------------- ------------
   |               |                 |
   |               |                 `------ The "inputcurrent" value from the real plugin
   |               `------------------------ The real plugin's name (symlink)
   `---------------------------------------- The host name from which to seek information
- 22 - 24: Similarly for “outputtotal”.
- 26 - 35: Like the above, but for power instead. Note that this virtual plugin graphs only “one” value, and as such, only “one” “sum” mechanism is used.
Result graphs
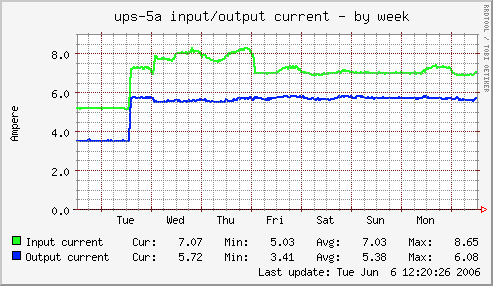
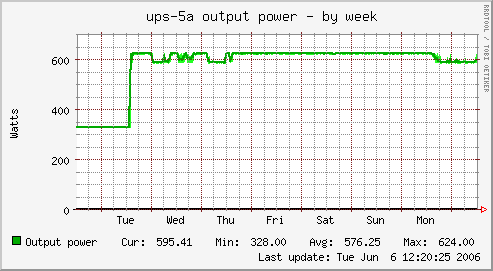
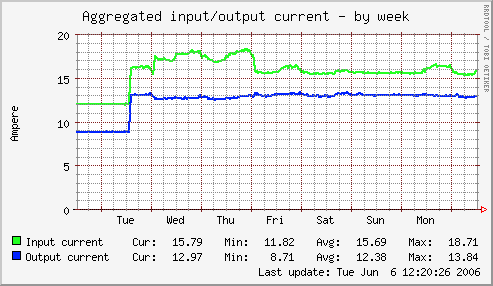
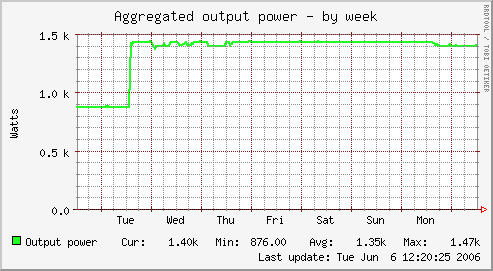
The graphs below show one of the UPSes, and the aggregated values. The graphs used are by week, because they had a nice dip in the beginning of the graphing period :-)
Source graphs for one of the UPSes:
Aggregate graphs:
Summary
We have now, in addition to the two real UPS nodes “ups-5a” and “ups-5b” (lines 1 - 5), created one virtual host named “Aggregated” (line 7) with two virtual plugins: “snmp_ups_current” (lines 11 - 24) and “snmp_ups_power” (lines 26 - 35).
The “snmp_ups_current” virtual plugin outputs two field names: “inputtotal” (lines 16 and 19 - 21) and “outputtotal” (lines 17 and 22 - 24), while the “snmp_ups_power” virtual plugin outputs only one field name, namely “output” (lines 31 - 35).
Further reading
- Graph aggregation stacking example
- Using SNMP plugins
- munin.conf directives explained